
Charts Project in React
A modern, user-friendly charts for viveing data in beatufil way
Item Description
Dynamic Chart Visualization App
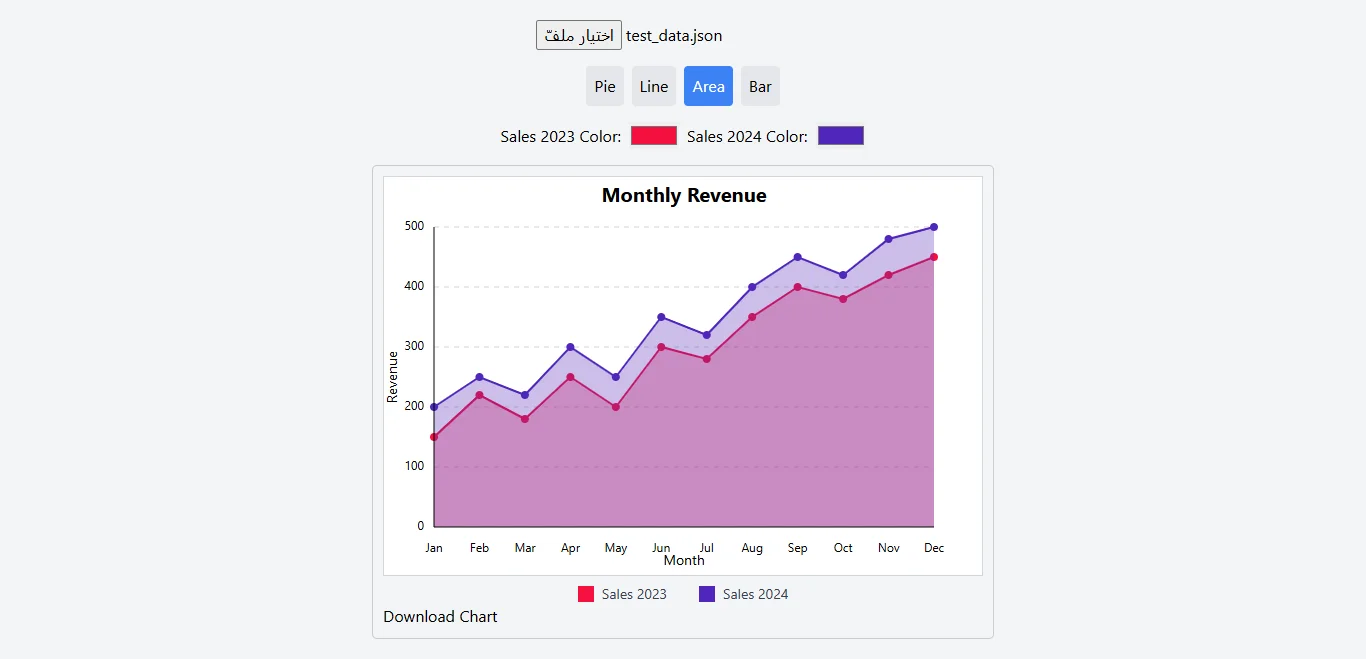
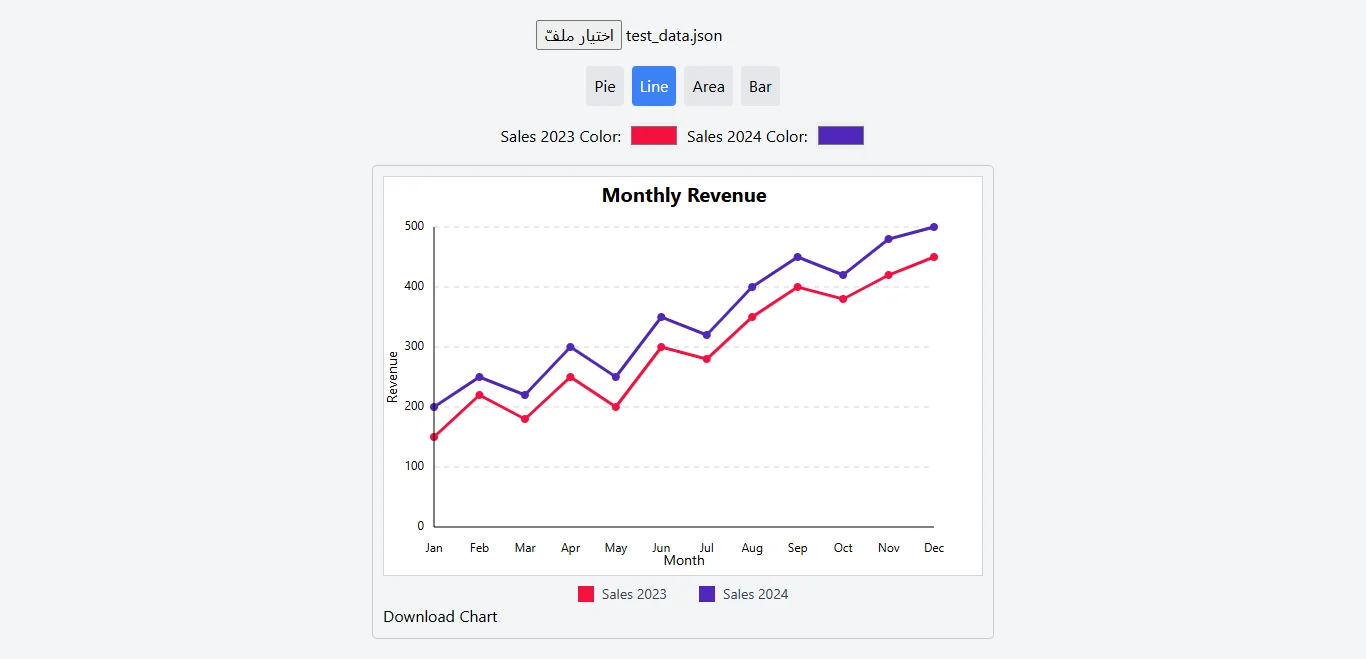
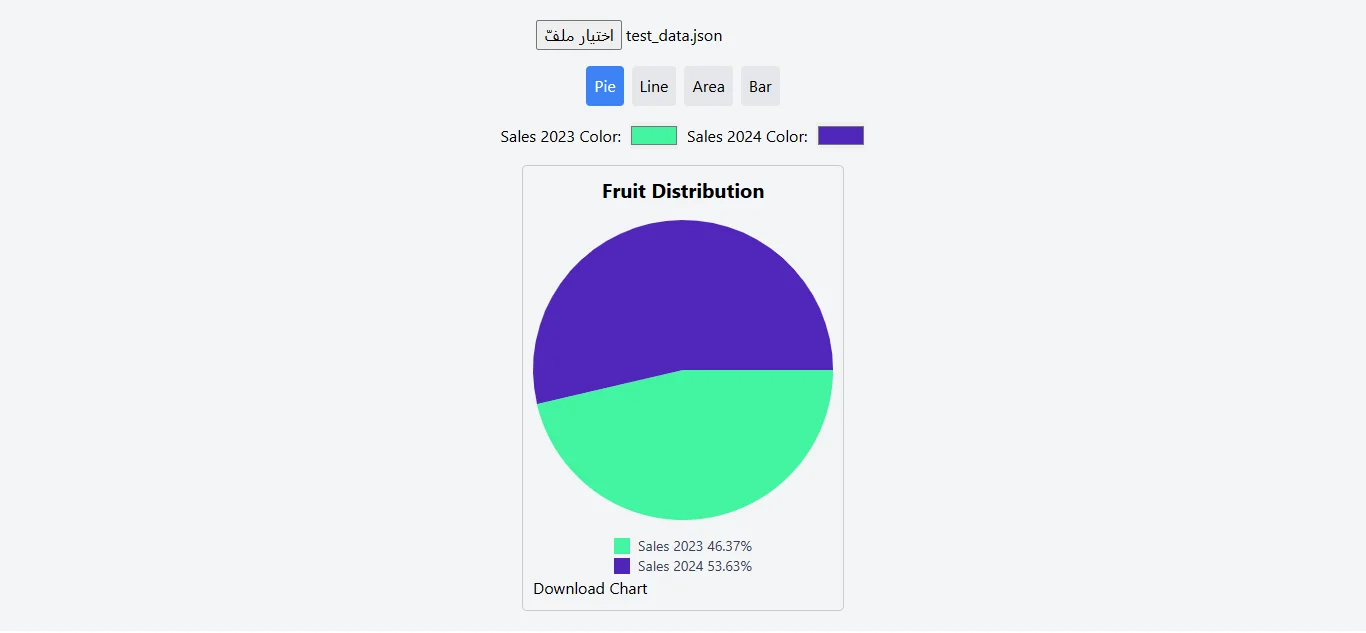
This is a React application that allows users to visualize data using various chart types. It provides features for customizing the data source, chart appearance, and exporting the charts.
JSON Data Structure
The application expects a JSON file with the following structure:
{
"dataSets": [
{
"name": "Dataset 1 Name",
"data": [
/* array of numerical data points */
],
"color": "#RRGGBB" // Optional: Hex color code for this dataset
},
{
"name": "Dataset 2 Name",
"data": [
/* array of numerical data points */
],
"color": "#RRGGBB" // Optional
}
// ... more datasets
],
"labels": [
/* array of string labels for the X-axis */
]
}
dataSets: An array of objects, where each object represents a dataset to be plotted.
name: The name of the dataset (string), displayed in the legend and tooltips.
data: An array of numerical values representing the data points for this dataset.
color (Optional): A string representing the color for this dataset in hex format (e.g., "#FF6F61"). If not provided, a default color will be assigned.
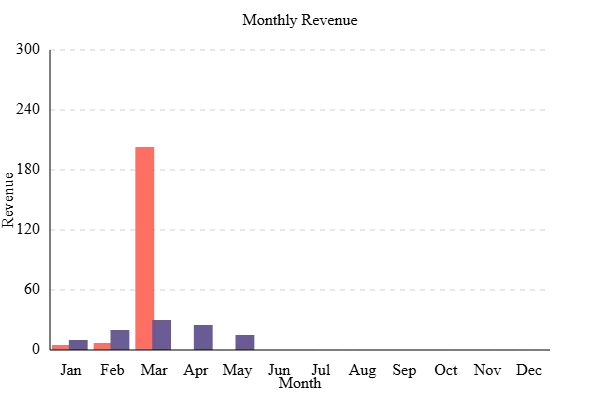
labels: An array of strings representing the labels for the X-axis (e.g., months, categories). This is used for Line, Bar, and Area charts.
See public/test_data.json for a working example.
Getting Started
This project was bootstrapped with Create React App.
Prerequisites
Node.js and npm (or yarn) installed on your machine.
Installation
Clone the repository (or download the source code).
Navigate to the project directory in your terminal.
Install the dependencies:
npm install
# or
yarn install
Running the Application
Start the development server:
npm start
# or
yarn start
Open http://localhost:3000 (or the port specified in the output) in your web browser.
Available Scripts
In the project directory, you can run:
npm start / yarn start: Runs the app in development mode.
npm test / yarn test: Launches the test runner.
npm run build / yarn build: Builds the app for production.
npm run eject / yarn eject: Ejects from Create React App configuration (use with caution).
Features
Features
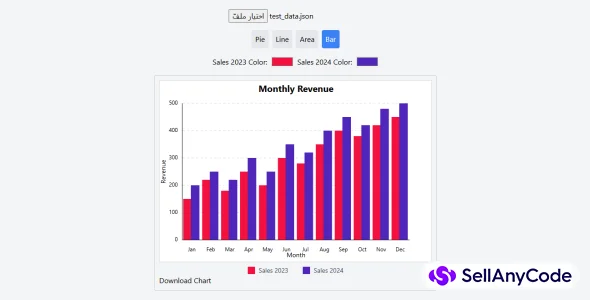
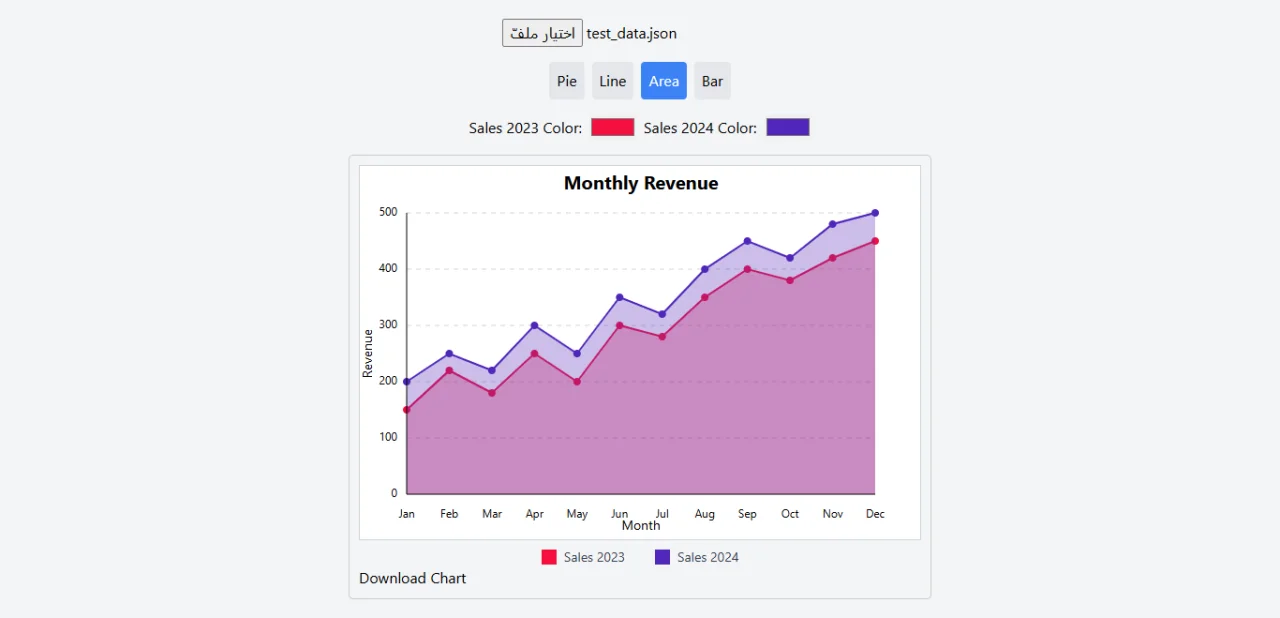
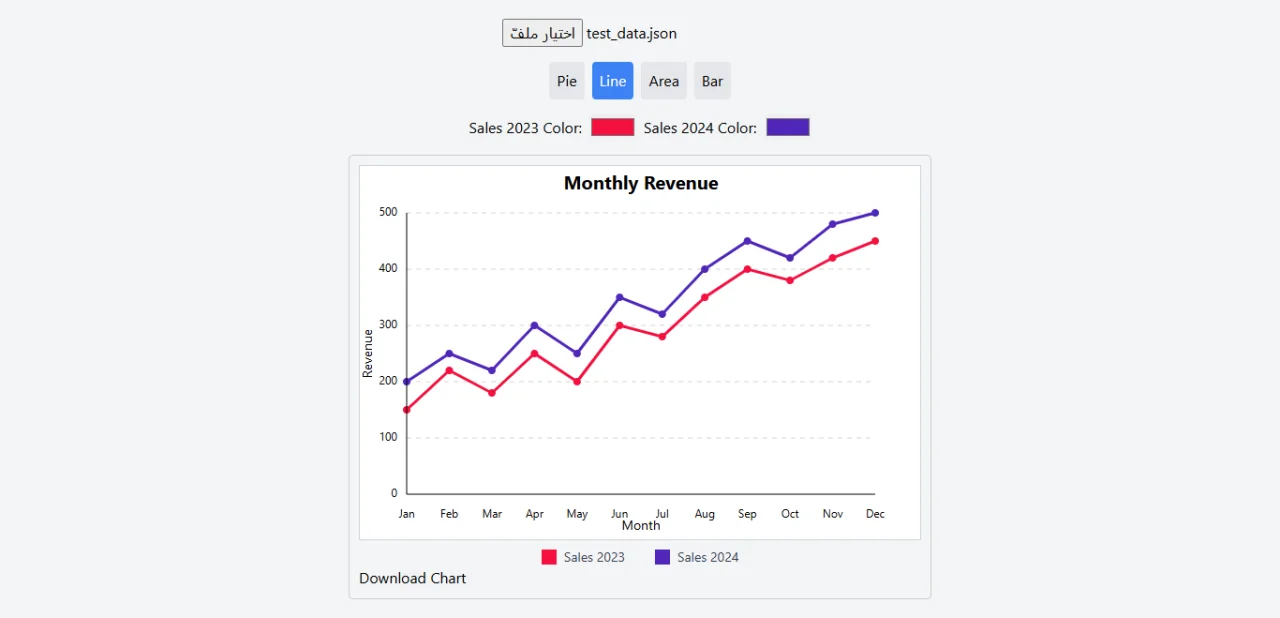
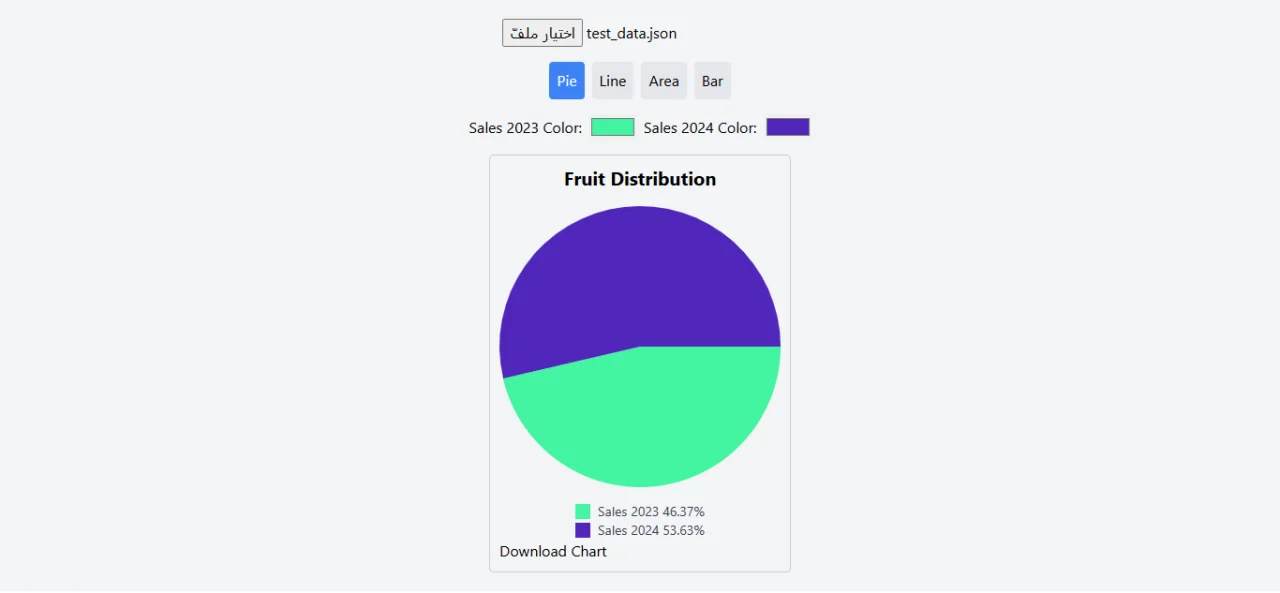
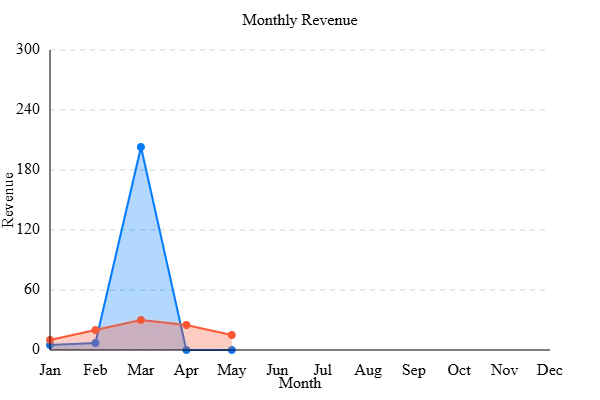
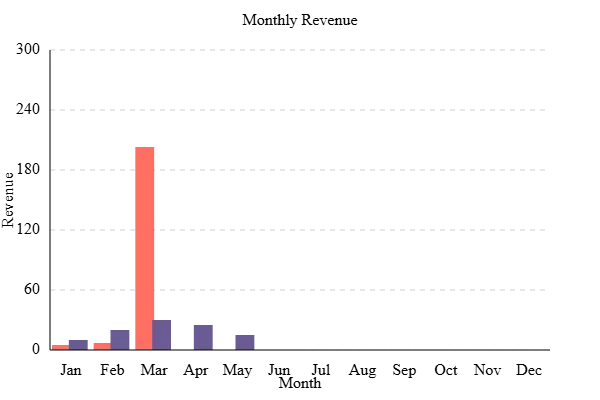
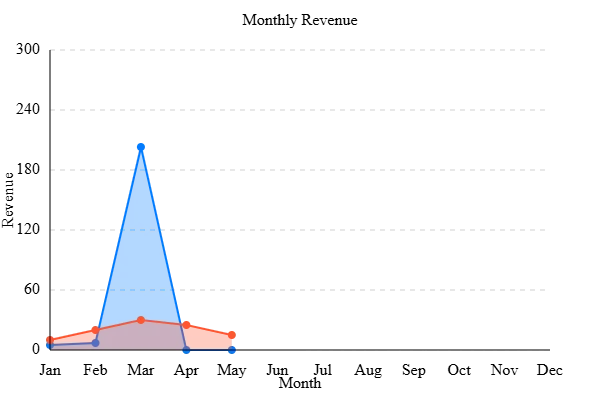
- Multiple Chart Types: Supports Line, Bar, Area, and Pie charts. Users can easily switch between chart types using toggle buttons.
- Dynamic Data Loading: Users can upload their own data in JSON format. The application parses the JSON file and updates the charts accordingly. A sample JSON file (
public/test_data.json) is provided to show the expected structure. - Color Customization: Users can change the color for each dataset using interactive color pickers. These colors are reflected in the chart visualization and legend. The JSON data format also supports an optional
colorproperty for each dataset. - Chart Download: Users can download the currently displayed chart as a PNG image file using the "Download Chart" button.
- Interactive Legend: The chart legend is interactive. Clicking on a legend item toggles the visibility of the corresponding dataset in the chart. Hovering over a legend item highlights the corresponding dataset.
- Tooltips: Hovering over data points or chart segments displays a tooltip with detailed information.
$ 7
- Verified source code
- Join 35192+ buyers which trust us!
- Download code immediately

100% Guarantee For Item!
Satisfaction guarantee policy.
Satisfaction guarantee policy.
Information
| Category | Scripts & Code / JavaScript |
| First Release | 9 April 2025 |
| Files included | .html, .css, Javascript .js |
| File Size | 83 MB |
| Frameworks | JavaScript |
Similar Items


Prime
$29